10 Best Cities to Rent Your Own Home in the Netherlands
Compare 10 Dutch cities for renting your own home using Q2 2026 free-sector asking-rent signals, connections, work and study fit, and application checks.
Short version
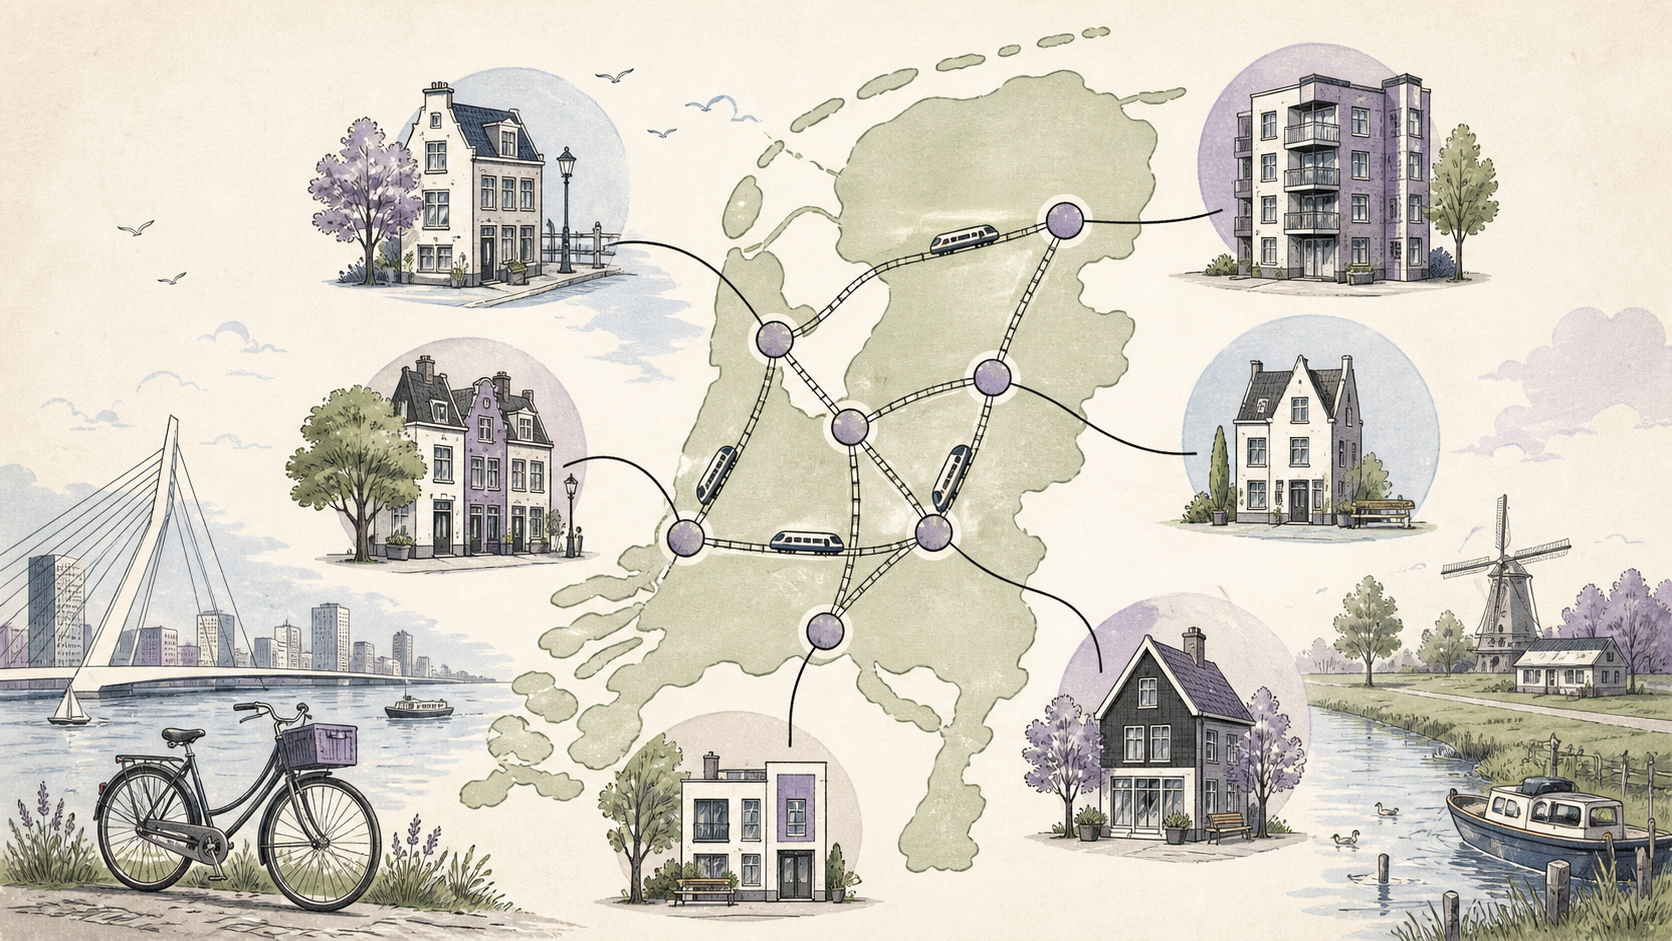
The best city to rent your own home depends on the life you need to support. Utrecht is a strong starting point for a renter who values central connections. Eindhoven can suit a technology or engineering commute. Rotterdam offers large-city choice, while Arnhem, Nijmegen, Amersfoort and Zwolle create lower-rent alternatives to test. Groningen, Breda and Almere add different work, study and regional trade-offs.
The numeric context comes from Pararius’s Q2 2026 professional free-sector listing data. The national signal was €20.94 per m². In the same city dataset, the signals ranged from €15.21 per m² in Zwolle to €28.69 in Amsterdam. Those figures set expectations for advertised basic rent. They do not decide which home will work for your income, commute, household or registration needs.
Who this shortlist is for
- Renters choosing a Dutch city before they begin applying for homes.
- Workers and students comparing city access with a manageable monthly budget.
- Households deciding whether a larger city, regional centre or lower-rent alternative fits better.
- International renters who need to check registration and contract details at address level.
If you have a shortlist of actual homes, the rental options comparison records real homes, and the full cost of renting adds the charges that decide affordability. A city average is useful at the search stage; a real listing is what determines an application decision.
How this list was built
The exact question
The question was: which Dutch cities deserve a serious comparison when a renter wants a self-contained home and must balance cost, access and practical fit? That question is different from “which city has the highest quality of life?” and from a ranking of cities for one narrow audience.
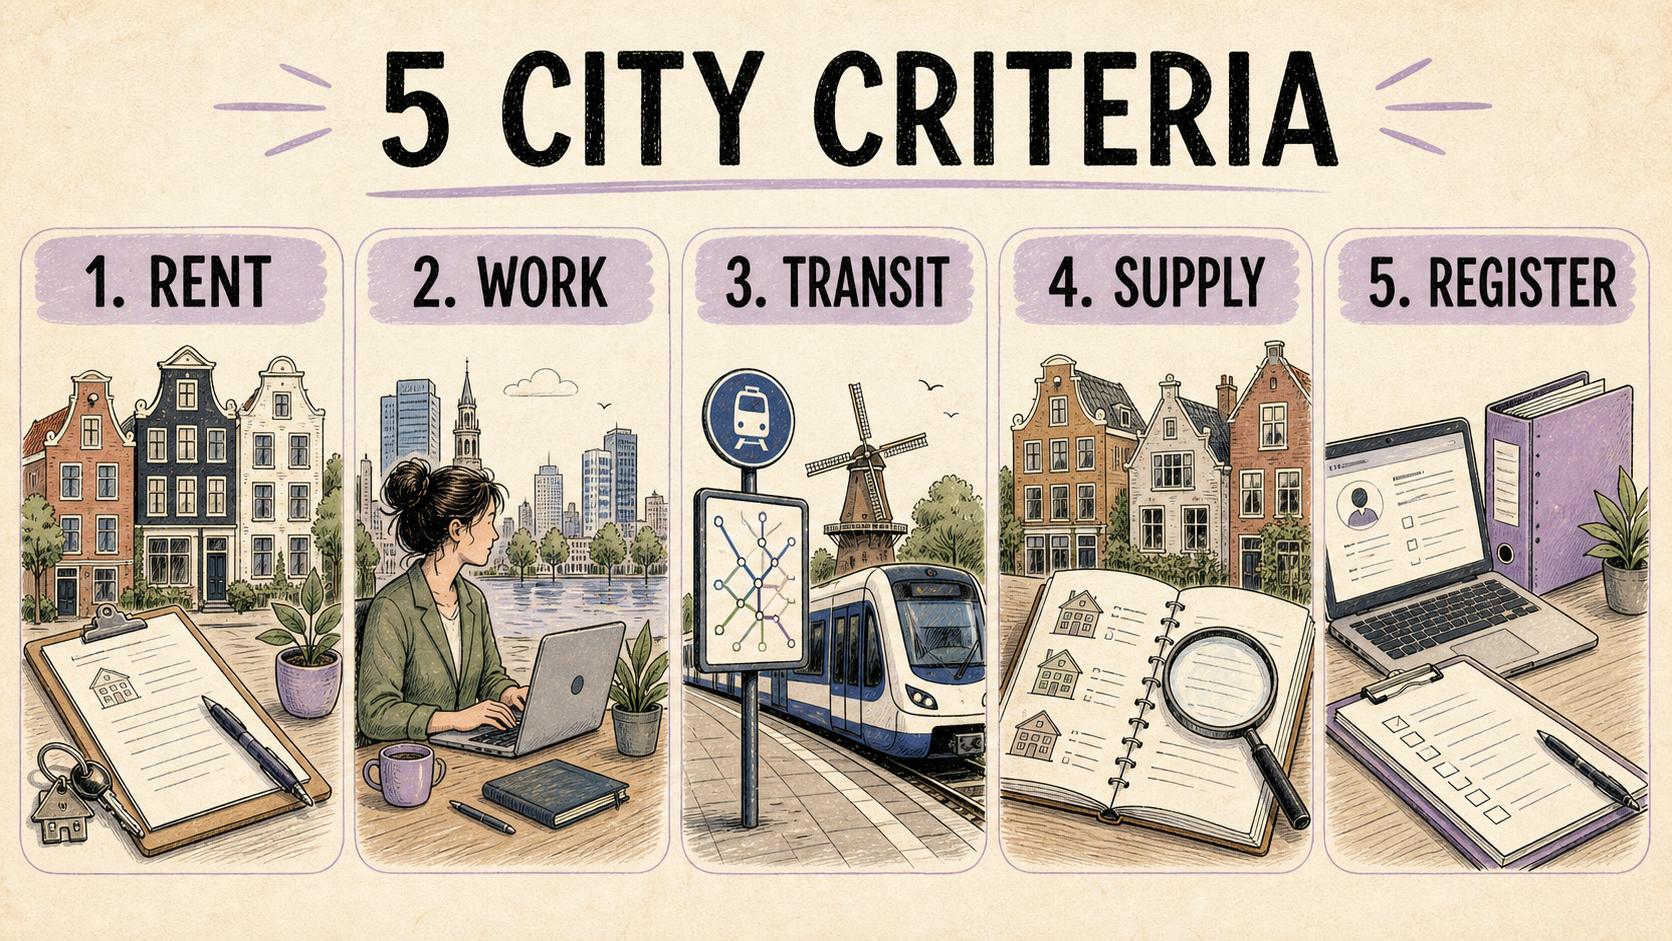
Five criteria for a useful shortlist
Each city was reviewed against five factors:
- Current rent signal: a lower Q2 2026 asking-rent signal receives more weight at the shortlist stage. For a simple screen, a signal at or below €18 per m² is low, €18.01 to €21 is middle, and above €21 is high. These bands are editorial thresholds, not market rules.
- Connection fit: consider the actual work, study and family destinations you will travel to. A city’s position on a map says less than your door-to-door route.
- Work and study fit: check whether the local employment or education pattern matches your reason for moving. A city can be attractive in general and still be a poor daily base for your routine.
- Household and home fit: compare size, furnishing, outdoor space, condition and neighbourhood with the needs of everyone who will live there.
- Application and registration fit: verify that the specific address permits the registration route and contract arrangement you need. A city cannot guarantee that an individual listing is suitable.
The list is therefore a set of cities worth comparing, with category picks for common situations. It is not a league table with one winner.
The evidence boundary
Pararius’s Q2 2026 report covered professional free-sector listings and reported a 27-response average per newly listed home, down nearly 52% from Q2 2025. The city map included 40 cities and used a stated minimum of more than 30 measurements per included city. This is useful for comparing asking-rent signals, while the sample remains different from every rental home in the country.
The 50 m² examples below use one reproducible calculation:
reported city signal per m² × 50 m² = illustrative monthly basic rent
The calculation excludes utilities, service charges, insurance, furnishing, transport, deposits and any income test. It also does not imply that a 50 m² home is available in each city.
Quick picks
Best overall starting point: Utrecht. It combines a central location with a broad range of work, study and travel patterns. Its €21.61 per m² Q2 signal is above the national average, so access has to earn its place in the budget.
Best technology and engineering fit: Eindhoven. The €20.25 per m² signal is below Utrecht and Rotterdam in this dataset. Check the exact workplace route because a city-level label does not price the daily commute.
Best large-city option: Rotterdam. Rotterdam offers an urban environment and a €22.79 per m² signal. It is a choice for renters who value city scale enough to accept a higher basic-rent starting point.
Best lower-rent city with broad comparison value: Arnhem. At €17.37 per m², the signal is lower than the national average. Test it against your regional work route, home type and registration requirements.
Best low-rent benchmark: Zwolle. Its €15.21 per m² signal is among the lowest in the selected ten. Its 12.19% Q2 year-on-year increase is a reminder to treat a low current figure as a snapshot.
The 10 cities worth comparing
1. Utrecht
Q2 signal: €21.61 per m². Illustrative 50 m² basic rent: about €1,081 per month.
Utrecht is a practical first test for renters whose work, study or family life reaches several parts of the country. Its central position can reduce the risk of choosing a cheap city that creates an exhausting daily route. The trade-off is clear in the data: the signal is above the €20.94 national average.
Best fit: a renter who values connection and wants a broad national search radius. Check before applying: door-to-door travel, contract type, service charges and whether the address supports the registration route you need.
2. Eindhoven
Q2 signal: €20.25 per m². Illustrative 50 m² basic rent: about €1,013 per month. The signal rose 11.95% year on year in the Q2 city data.
Eindhoven deserves a place for renters whose work or study is tied to the city’s technology, engineering or regional business base. It offers a lower starting signal than Utrecht, while the year-on-year movement argues for checking current listings rather than relying on an old budget.
Best fit: a renter with a clear Eindhoven-area destination. Check before applying: the real workplace route, cycling or transit options, and whether the home’s size and furnishing match the price.
3. Rotterdam
Q2 signal: €22.79 per m². Illustrative 50 m² basic rent: about €1,140 per month. The signal rose 7.75% year on year.
Rotterdam is the urban-scale pick in this group. It can suit renters who want a large city, varied neighbourhoods and access to major employment and education destinations. That breadth comes with a higher basic-rent signal than the national average, so compare the full monthly cost before treating choice as value.
Best fit: a renter who prioritises urban choice and has a budget for it. Check before applying: the neighbourhood-level commute, energy label, service charges and total cost of furnished or upholstered homes.
4. Groningen
Q2 signal: €19.27 per m². Illustrative 50 m² basic rent: about €964 per month. The signal rose 5.29% year on year.
Groningen is a strong comparison point for renters whose study, research or regional work is based in the north. Its signal sits below the national average, but lower basic rent does not remove the need to check supply, contract terms and the distance from other destinations in your life.
Best fit: a renter whose routine is genuinely northern rather than a frequent Randstad commuter. Check before applying: housing type, cycling and public-transport route, registration and whether the sample listing is furnished.
5. Arnhem
Q2 signal: €17.37 per m². Illustrative 50 m² basic rent: about €869 per month. The signal rose 5.06% year on year.
Arnhem is the lower-cost regional-city candidate in the ten. It can make the shortlist when you want a city setting without starting at the rent signals seen in Utrecht or Rotterdam. Its value depends on the exact employment area and on finding a home whose condition and size do not erase the price difference.
Best fit: a renter with work or study in the eastern or central-east region. Check before applying: the full route, neighbourhood supply, service charges and the address’s registration position.
6. Nijmegen
Q2 signal: €18.29 per m². Illustrative 50 m² basic rent: about €915 per month. The signal rose 7.32% year on year.
Nijmegen combines a lower Q2 rent signal with an established university and regional-city role. It suits a renter who wants more city life than a small town can offer and can keep daily travel within the region. The year-on-year increase shows why a saved listing and a current application budget should be based on today’s supply.
Best fit: a student, professional or household with a Nijmegen-area routine. Check before applying: seasonal competition, home size, bicycle or transit route and the complete monthly charge.
7. Amersfoort
Q2 signal: €17.76 per m². Illustrative 50 m² basic rent: about €888 per month. The signal rose 0.82% year on year.
Amersfoort is useful for renters who want a smaller city with central access. Its Q2 signal is below the national average and its reported year-on-year change was modest in this dataset. The central-access argument still needs a calculation based on your destination, because an affordable home can lose its advantage through frequent travel.
Best fit: a renter comparing central regional living with larger-city prices. Check before applying: the commute at the times you actually travel, home availability, contract duration and transport cost.
8. Zwolle
Q2 signal: €15.21 per m². Illustrative 50 m² basic rent: about €761 per month. The signal rose 12.19% year on year.
Zwolle is the lowest-rent signal among these ten. That makes it a valuable benchmark for a budget search, while the sharp year-on-year movement is a useful warning against turning one quarter into a permanent expectation. Compare the current listing’s size, condition, furnishing and route with a more expensive city before deciding.
Best fit: a renter whose work, study or family routine fits the north-east and who wants a lower starting signal. Check before applying: actual availability, registration, extra charges and the cost of travel outside the region.
9. Breda
Q2 signal: €18.89 per m². Illustrative 50 m² basic rent: about €945 per month. The signal rose 3.95% year on year.
Breda gives the shortlist a southern urban option with a Q2 signal below the national average. It is worth comparing when your work, family or study pattern is in the south of the country. A lower city average cannot answer whether the particular home has the right neighbourhood, insulation, furnishing or contract terms.
Best fit: a renter who needs a southern city and wants to test a below-average basic-rent signal. Check before applying: work route, transport frequency, energy costs and the difference between asking rent and total monthly cost.
10. Almere
Q2 signal: €19.32 per m². Illustrative 50 m² basic rent: about €966 per month. The signal rose 10.64% year on year.
Almere is a useful comparison for renters weighing newer housing or space against access to the Amsterdam region. Its signal is below the national average and well below Amsterdam’s €28.69 per m² Q2 signal, yet the commute and transport budget belong in the same decision. A lower basic rent can be a poor exchange if the daily route is frequent and expensive.
Best fit: a renter with a clear regional travel plan who is comparing space and access. Check before applying: door-to-door travel, transport costs, service charges, energy performance and registration.
Comparison cards for scanning
Use these cards to narrow the list before you inspect individual homes. The “fit” line is an editorial starting point; the “check” line is the part that needs evidence from a live listing.
Utrecht
- Rent signal: €21.61 per m², about €1,081 for 50 m².
- Fit: central access and a wide search radius.
- Main check: whether the access premium fits the full budget.
Eindhoven
- Rent signal: €20.25 per m², about €1,013 for 50 m².
- Fit: a clear technology, engineering or regional work route.
- Main check: the exact workplace connection.
Rotterdam
- Rent signal: €22.79 per m², about €1,140 for 50 m².
- Fit: urban choice and large-city routines.
- Main check: neighbourhood cost and service charges.
Groningen
- Rent signal: €19.27 per m², about €964 for 50 m².
- Fit: northern study, research or regional work.
- Main check: distance from other regular destinations.
Arnhem
- Rent signal: €17.37 per m², about €869 for 50 m².
- Fit: a lower-cost regional city.
- Main check: home condition and registration.
Nijmegen
- Rent signal: €18.29 per m², about €915 for 50 m².
- Fit: university and regional-city routines.
- Main check: current competition and seasonal supply.
Amersfoort
- Rent signal: €17.76 per m², about €888 for 50 m².
- Fit: smaller-city living with central access.
- Main check: actual commute and transport cost.
Zwolle
- Rent signal: €15.21 per m², about €761 for 50 m².
- Fit: a lower-rent north-eastern benchmark.
- Main check: whether the low signal is available for your home type.
Breda
- Rent signal: €18.89 per m², about €945 for 50 m².
- Fit: a southern urban search.
- Main check: full monthly cost and work route.
Almere
- Rent signal: €19.32 per m², about €966 for 50 m².
- Fit: a space-and-access comparison around the Amsterdam region.
- Main check: the recurring cost of the commute.
How to choose your city from the shortlist
- Pin the non-negotiable destination. Use the workplace, campus, family care or other place you will visit most often.
- Set a full monthly ceiling. Start with basic rent, then add service charges, utilities, insurance, transport, furnishings and a realistic reserve. A total rental cost clarifies the categories.
- Choose three cities, not one. Keep one access-first option, one budget-first option and one compromise option. This makes the search resilient when listings disappear.
- Score real homes from 0 to 2. Give points for work or study fit, complete monthly cost, travel pattern, registration and home type. A maximum of 10 is a comparison aid, not a promise that the highest score will be available.
- Verify the application file. A complete rental process verifies the contract before sensitive documents or money change hands.
For an international move, compare this broad shortlist with the expat city shortlist on registration and arrival constraints; this comparison keeps its focus on whether a renter’s whole routine can work.
Families can apply the same city comparison to school, space, daily travel and registration with the family-friendly city shortlist.
Three narrower city lenses extend this broad shortlist: cities with rent under €1,000 for a cost-first screen, cities for retiree renters for access and future-fit questions, and cities for renting near Schiphol for airport journeys and shift times. Each link names a different decision question, so the broad comparison can remain the starting point.
What can make a “best city” label misleading?
A city average hides the home. A 35 m² studio, a furnished 50 m² apartment and a bare 70 m² family home carry different costs and uses.
The dataset measures listed professional free-sector homes. It does not describe social housing, every private landlord, the full stock or the chance that you will win a particular application.
Rent per m² is not the monthly total. A cheaper basic rent can be paired with higher service charges, energy costs, furniture needs or travel costs.
Trend data is a signal, not a forecast. Zwolle’s 12.19% Q2 year-on-year movement and Eindhoven’s 11.95% movement show why current listings matter. They do not predict the next quarter.
Registration is address-specific. Confirm the municipality and landlord position for the home you intend to rent. Do not infer it from the city name.
Frequently asked questions
Which Dutch city is best for renting your own home?
There is no universal answer. Utrecht is a strong access-first starting point, while Eindhoven, Rotterdam, Groningen, Arnhem, Nijmegen, Amersfoort, Zwolle, Breda and Almere suit different combinations of work, study, budget and regional routine. Score actual homes after choosing three cities.
Which city is the cheapest in this shortlist?
Zwolle has the lowest Q2 2026 asking-rent signal among the ten at €15.21 per m². The separate cheapest-rental-city shortlist ranks 15 cities by the same per-m² definition; the figure remains a starting signal.
Is a lower rent per m² always better value?
No. It can be helpful for screening, but value also depends on size, condition, furnishing, service charges, utilities, transport and registration. Apply the same full-cost test to every live listing.
How much is 50 m² in these cities?
The calculation multiplies the reported city signal by 50. For example, Utrecht is €21.61 × 50, or about €1,081. This is illustrative basic rent and should not be read as a guaranteed listing price.
Should I choose a city before I have a job?
Build a shortlist instead of committing to one city. Use likely work locations, travel tolerance and budget to keep an access-first, budget-first and compromise option open until you can compare real homes.
Does the city guarantee registration?
No. Registration depends on the address, the contract and the municipality’s rules and process. Verify the specific home before you rely on it for a move.
Next step
Pick three cities from the list, calculate the full monthly ceiling for each and record two real homes per city. Then compare them on cost, route, home type, contract and registration using the rental options comparison.
City-level asking-rent signals help set a search boundary, but they do not price a particular home. Compare the full monthly cost, travel needs, documents and contract before treating a city as the right fit.
Ask about comparing rental cities →