15 Cheapest Cities to Rent in the Netherlands
Compare the 15 lowest Q2 2026 free-sector asking-rent signals among 40 Dutch cities, with 50 m² calculations and practical budget checks.

Short version
Using one consistent definition, the 15 cheapest cities here are the cities with the lowest reported professional free-sector asking-rent signals per m² in Pararius’s Q2 2026 city dataset. Enschede ranked first at €14.95 per m², followed by Bergen op Zoom at €15.18 and Zwolle at €15.21. Dordrecht closed the 15-city group at €18.53 per m².
That ranking is a useful first filter. It is not a complete monthly budget and it does not mean that a renter will find a suitable home at the city average. The national Q2 signal was €20.94 per m², while Amsterdam was €28.69. A 50 m² illustration therefore comes to about €748 in Enschede and €1,435 in Amsterdam before service charges, utilities, insurance, furnishing, transport and other costs.
Who this list is for
- Renters who can choose a region and want to start with a lower basic-rent signal.
- Workers, students and households deciding whether a cheaper city is worth a longer or different routine.
- Applicants comparing a low-rent city with a larger employment or education centre.
- Anyone who wants to test a real listing against a complete budget before sending an application.
If the city is already part of a shortlist, record actual homes on the rental options comparison. Then add the costs that a per-m² signal cannot show to the total rental cost.
What “cheapest” means here
“Cheapest” means lowest reported asking rent per m² among 40 included cities in the Q2 2026 Pararius city dataset. It does not mean lowest total monthly spend, lowest rent for every home type, lowest social-housing rent, or easiest city in which to find a home.
The report describes professional free-sector listings. Its methodology limits the included city observations and excludes specified small or large homes and low-rent outliers. It also uses a harmonic mean and percentile trimming for its rent-per-m² calculations. That makes the signals more comparable, while the result remains a market sample rather than a census of Dutch rental homes.
Here is the reproducible calculation:
reported asking rent per m² × 50 m² = illustrative monthly basic rent
For example, Enschede is €14.95 × 50 = €747.50, rounded to €748. Amsterdam is €28.69 × 50 = €1,434.50, rounded to €1,435. The difference is about €687 per month under the same size assumption. It is a comparison of basic-rent signals, not a claim that equivalent homes or equivalent total costs exist in both cities.
The 15 lowest Q2 rent signals at a glance
Ranks 1 to 5
1. Enschede
- Q2 signal: €14.95 per m².
- 50 m² illustration: about €748 basic rent per month.
- Decision angle: one of the clearest low-rent starting points, provided work, study and family routines fit the east of the country.
2. Bergen op Zoom
- Q2 signal: €15.18 per m².
- 50 m² illustration: about €759 basic rent per month.
- Decision angle: worth testing for a renter whose daily life works in the south-west region and who can verify the smaller-city supply.
3. Zwolle
- Q2 signal: €15.21 per m².
- 50 m² illustration: about €761 basic rent per month.
- Decision angle: a low current signal with a 12.19% year-on-year increase, so use current listings rather than assuming the gap will remain.
4. Leeuwarden
- Q2 signal: €15.26 per m².
- 50 m² illustration: about €763 basic rent per month.
- Decision angle: a northern budget candidate; compare regional work access and travel costs before applying.
5. Apeldoorn
- Q2 signal: €15.55 per m².
- 50 m² illustration: about €778 basic rent per month.
- Decision angle: a lower-rent regional option for people whose routine does not require a daily large-city commute.
Ranks 6 to 10
6. Ede
- Q2 signal: €16.23 per m².
- 50 m² illustration: about €812 basic rent per month.
- Decision angle: a modest city signal with a 13.55% year-on-year increase, which makes date and listing freshness important.
7. Helmond
- Q2 signal: €16.81 per m².
- 50 m² illustration: about €841 basic rent per month.
- Decision angle: a budget candidate near a larger regional employment area, where the actual route and transport cost need testing.
8. Alkmaar
- Q2 signal: €17.17 per m².
- 50 m² illustration: about €859 basic rent per month.
- Decision angle: the signal fell 3.39% year on year in the dataset, but one period does not establish a lasting trend.
9. Roermond
- Q2 signal: €17.18 per m².
- 50 m² illustration: about €859 basic rent per month.
- Decision angle: useful for a southern regional search when the workplace, study place and registration plan are compatible.
10. Arnhem
- Q2 signal: €17.37 per m².
- 50 m² illustration: about €869 basic rent per month.
- Decision angle: a lower-rent city option with a stronger urban comparison case than the very smallest markets.
Ranks 11 to 15
11. Veldhoven
- Q2 signal: €17.51 per m².
- 50 m² illustration: about €876 basic rent per month.
- Decision angle: compare the home and route with Eindhoven-area options instead of treating a nearby municipality as an automatic bargain.
12. Amersfoort
- Q2 signal: €17.76 per m².
- 50 m² illustration: about €888 basic rent per month.
- Decision angle: a central-city alternative with a lower signal than the largest Randstad markets; price the actual commute.
13. Zoetermeer
- Q2 signal: €18.18 per m².
- 50 m² illustration: about €909 basic rent per month.
- Decision angle: a lower signal inside the Randstad comparison, with the need to test travel and local housing type.
14. Nijmegen
- Q2 signal: €18.29 per m².
- 50 m² illustration: about €915 basic rent per month.
- Decision angle: a regional university-city candidate where a slightly higher signal may buy a better fit for study or work.
15. Dordrecht
- Q2 signal: €18.53 per m².
- 50 m² illustration: about €927 basic rent per month.
- Decision angle: a lower-signal urban option whose value depends on the exact route and the home’s complete monthly charges.
A closer look at the 15 cities
The ranking answers one narrow question. Use the notes below to decide what to verify next.
1. Enschede
Enschede has the lowest reported signal in this 15-city set. The illustrative calculation is €14.95 × 50 = €747.50, or about €748. That creates a meaningful budget starting point for someone whose work, study or household life is in the east. The price advantage weakens if the city requires frequent long-distance travel.
Verify: the work or campus route, the home’s size and condition, service charges, registration and whether the listing’s furnishing changes the apparent saving.
2. Bergen op Zoom
At €15.18 per m², Bergen op Zoom produces an illustrative 50 m² basic rent of about €759. Its position is attractive for a south-west regional search, especially when a renter can choose the region rather than a fixed central-city job. A lower city signal also deserves a supply check because fewer suitable homes can make the search slower.
Verify: current local listings, the commute to the actual destination, contract terms and whether the address supports registration.
3. Zwolle
Zwolle’s €15.21 per m² signal gives a 50 m² illustration of about €761. It is the lowest signal after Enschede and Bergen op Zoom, yet its 12.19% year-on-year increase is one of the clearest reminders that “cheap” is time-sensitive. Use the current listing and date as the evidence for a decision.
Verify: whether the price applies to the home type you need, the recurring travel cost and the complete monthly charge.
4. Leeuwarden
Leeuwarden is close to Zwolle in the Q2 ranking at €15.26 per m², or about €763 for 50 m². It can fit a renter with a northern routine and a flexible location choice. For someone commuting to the Randstad every day, the basic-rent saving may be offset by time and travel.
Verify: frequency of travel outside the region, transport costs, home type, energy costs and registration.
5. Apeldoorn
Apeldoorn’s €15.55 per m² signal translates to about €778 for 50 m². It is a reasonable candidate for a regional search and for a household that prefers more space or a calmer setting than a large city can offer. The city should be compared with the actual workplace area, not with a national map alone.
Verify: door-to-door travel, neighbourhood supply, basic rent versus service charges and contract duration.
6. Ede
Ede sits at €16.23 per m², which gives a 50 m² illustration of about €812. The 13.55% year-on-year increase makes the number especially dependent on the research date. A renter who finds a suitable home should test its full cost promptly instead of waiting for the city average to do the decision-making.
Verify: listing date, current availability, route, energy performance and the address’s registration position.
7. Helmond
Helmond’s €16.81 per m² signal gives about €841 for 50 m². It can be part of a budget search around the south-east, but the city’s value depends on how the renter reaches work, study and services. The 20.97% year-on-year increase in the Q2 dataset is a strong reason to treat the rank as a snapshot.
Verify: the real route, transport frequency, current asking rent, home quality and whether moving costs erase the initial saving.
8. Alkmaar
Alkmaar is at €17.17 per m², or about €859 for 50 m². The signal was 3.39% lower year on year in the dataset, although a single period cannot establish a durable decline. It is a useful candidate when the north of the Randstad fits the renter’s regular destinations.
Verify: travel to the actual work address, local supply, service charges and any difference between furnished and unfurnished homes.
9. Roermond
Roermond’s €17.18 per m² signal is almost identical to Alkmaar, with the same illustrative basic rent of about €859 for 50 m². The city earns consideration for a southern regional search. The best test is whether the lower rent supports the renter’s everyday route rather than simply looking good in a national ranking.
Verify: work and study access, transport alternatives, registration and the complete monthly budget.
10. Arnhem
Arnhem has a €17.37 per m² signal, or about €869 for 50 m². It is a useful bridge between low-rent regional candidates and larger-city comparisons. A renter may accept a modestly higher signal if the city makes work, study, services and social life easier to combine.
Verify: neighbourhood-level rent, home condition, commute, service charges and registration.
11. Veldhoven
Veldhoven’s €17.51 per m² signal creates an illustration of about €876 for 50 m². It should be compared with nearby homes and the renter’s actual destination. A municipality’s lower average cannot by itself establish that the total choice is cheaper once transport, furnishing and contract charges are added.
Verify: the address, route to work or study, local services, listing conditions and all recurring charges.
12. Amersfoort
Amersfoort comes in at €17.76 per m², or about €888 for 50 m². It is a strong comparison candidate for someone who wants central access without starting with the highest signals in the major cities. The central position only creates value when the renter’s regular journeys are frequent enough to benefit from it.
Verify: actual travel times and costs, the home’s size, contract term and registration.
13. Zoetermeer
Zoetermeer’s €18.18 per m² signal gives about €909 for 50 m². It is one of the lower-cost entries connected to a Randstad decision, so transport deserves as much attention as basic rent. A home that looks cheap in the listing can become a poor fit if the daily route is expensive or unreliable.
Verify: the complete route, peak-time travel, service charges, energy and the registration arrangement.
14. Nijmegen
Nijmegen is at €18.29 per m², or about €915 for 50 m². It is above the lowest-cost group, but its regional and university-city fit can make the extra signal rational for the right renter. Cost should be compared with the destination and home quality, not with an abstract rank alone.
Verify: seasonal supply, home type, commute, contract, service charges and the full application budget.
15. Dordrecht
Dordrecht closes the set at €18.53 per m², giving about €927 for 50 m². It is a useful lower-cost urban comparison when the south-west Randstad fits the renter’s routine. Its place in this list says where the Q2 signal sits, not whether a specific home is affordable.
Verify: the actual destination, neighbourhood conditions, transport cost, registration and all monthly charges.
Comparison cards for a budget shortlist
These cards are designed for phone-friendly scanning. The city signal answers “where should I look first?” The check answers “what must I prove before applying?”
Lowest current signal
- Cities: Enschede, Bergen op Zoom and Zwolle.
- 50 m² range: about €748 to €761 basic rent.
- Best use: start a budget-first search.
- Main risk: treating a small difference in city average as guaranteed availability.
Northern budget group
- Cities: Leeuwarden and Zwolle.
- 50 m² range: about €761 to €763 basic rent.
- Best use: a northern routine with flexible location choice.
- Main risk: long-distance travel can erase the basic-rent saving.
Regional middle group
- Cities: Apeldoorn, Ede, Helmond, Arnhem and Veldhoven.
- 50 m² range: about €778 to €876 basic rent.
- Best use: compare a lower signal with a regional work or study route.
- Main risk: rising signals and extra transport or furnishing costs.
Lower-cost urban comparison
- Cities: Alkmaar, Amersfoort, Zoetermeer, Nijmegen and Dordrecht.
- 50 m² range: about €859 to €927 basic rent.
- Best use: keep city access in the decision while testing a lower starting rent.
- Main risk: the commute, service charges or home quality can remove the apparent advantage.
Build the full budget before calling a city cheap
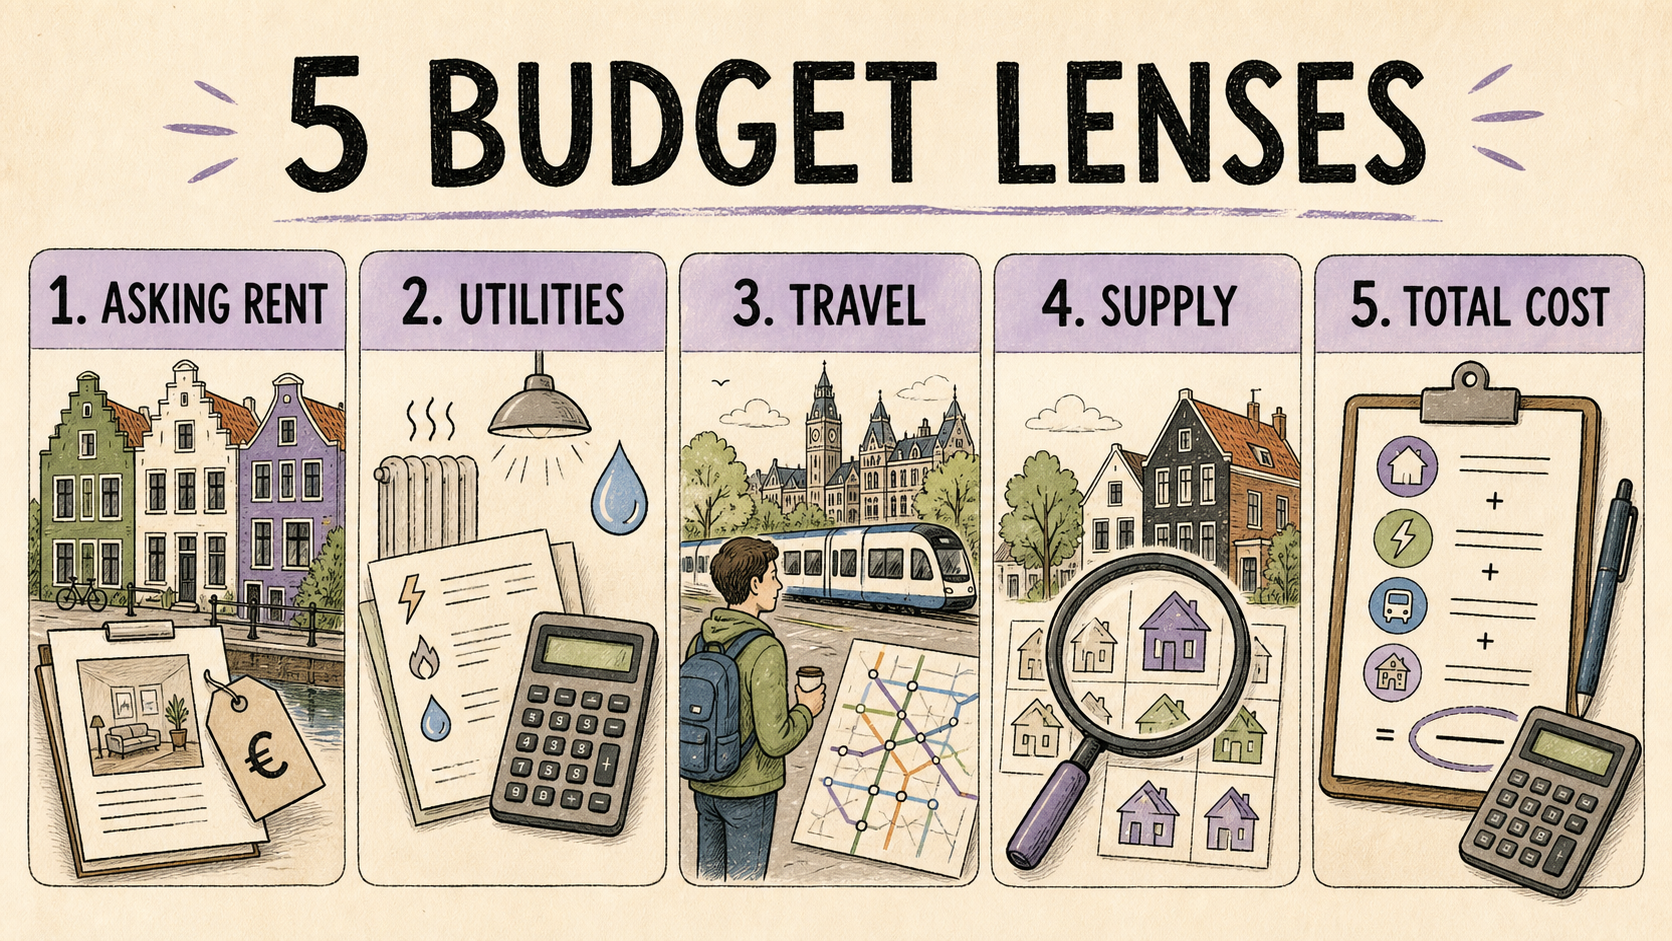
Use the city signal as a starting number, then calculate the actual monthly ceiling:
basic rent + service charges + utilities + insurance + transport + furnishing reserve = working monthly housing cost
Also plan for one-off costs such as a deposit, moving, connection charges and essential furniture. A lower basic rent still needs the furnished-versus-unfurnished choice to separate setup purchases from monthly price.
For a simple comparison, take the Enschede and Amsterdam illustrations:
- Enschede: €14.95 × 50 = €747.50, rounded to €748 basic rent.
- Amsterdam: €28.69 × 50 = €1,434.50, rounded to €1,435 basic rent.
- Illustrative gap: about €687 per month before other costs.
If travel from Enschede costs €250 more each month than travel from the alternative, and furnishing adds another €100 in the first-year reserve, the apparent gap is already smaller. Those are examples of the variables to calculate, not universal costs.
When the lowest rank is the wrong choice
The home is too small. A lower per-m² signal may still produce a total monthly cost that fails if the home cannot meet the household’s size requirement.
The listing is furnished or has high charges. Two homes with the same basic rent can have very different service charges, utilities and furnishing needs.
The commute is expensive. A cheaper city can be costly when work or study requires frequent long-distance travel. Price the recurring route.
Supply is thin for your requirements. The dataset’s city signal does not tell you how many suitable homes are available now, or how competitive the application will be.
The data is a snapshot. Helmond’s 20.97% and Ede’s 13.55% year-on-year increases show that the ordering can move. A current listing is stronger evidence for your decision than an old average.
Registration does not follow from the ranking. Confirm the specific address, contract and municipal registration route before relying on it for a move.
A five-step decision process
- Pick three cities. Keep one lowest-signal option, one city close to work or study and one compromise city.
- Set your full-cost ceiling. Add the categories above before comparing homes.
- Collect comparable listings. Record size, basic rent, charges, furnishing, energy information, contract and registration for each home.
- Test the route. Calculate door-to-door time and recurring transport cost for the days you actually travel.
- Prepare the application carefully. A complete rental process keeps the contract review in the right order before sharing sensitive documents or transferring money.
For a broader city decision that also weighs access, work, study and home fit, compare this cost-first list with 10 cities worth comparing for your own home.
Frequently asked questions
Which city is the cheapest to rent in the Netherlands?
Enschede had the lowest reported Q2 2026 professional free-sector asking-rent signal in the 40-city dataset used here, at €14.95 per m². That is a market-sample signal, not a guarantee that every home in Enschede is cheap or available.
What is the cheapest Dutch city for a 50 m² home?
Using the same illustration, Enschede is €14.95 × 50, or about €748 in basic rent. A real 50 m² home can differ by neighbourhood, condition, furnishing, charges and contract.
Is Enschede cheaper than Amsterdam?
The Q2 signals imply about €748 for 50 m² in Enschede and about €1,435 in Amsterdam, a basic-rent difference of roughly €687 under the same size assumption. Compare transport, home quality, service charges and work access before treating that as a final saving.
Are these cities cheap for social housing?
No conclusion about social housing follows from this ranking. The figures describe professional free-sector asking-rent observations and should not be used as social-housing prices or eligibility guidance.
Does a low rent-per-m² signal mean I can find a home quickly?
No. It does not measure current availability, application competition or the number of homes that meet your size, location and registration requirements. Check current listings and keep more than one city open.
What other costs should I add to rent?
Add service charges, utilities, insurance, transport and furnishing, then plan one-off costs such as the deposit and moving. A total rental cost sets out you a category-by-category budget structure.
Next step
Choose one city from the lowest-signal group, one city that fits your fixed destination and one compromise option. Put real homes from all three into the rental options comparison, then apply the full-cost and registration checks before you respond.
The Q2 2026 figures describe professional free-sector listings, not every home or your final monthly cost. Add service charges, utilities, travel and move-in cash before deciding that a city is affordable.
Ask about a rental budget →