10 Best Cities With Rent Under €1,000 in the Netherlands in 2026
Compare ten Dutch cities with a sub-€1,000 illustrative basic-rent signal for 50 m², plus the checks that make the budget realistic.

Short version
For a simple 50 m² screen, a city needs a reported asking-rent signal below €20.00 per m² to produce a basic-rent illustration below €1,000. The ten lowest qualifying signals in the Q2 2026 city data are Enschede, Bergen op Zoom, Zwolle, Leeuwarden, Apeldoorn, Ede, Helmond, Alkmaar, Roermond and Arnhem.
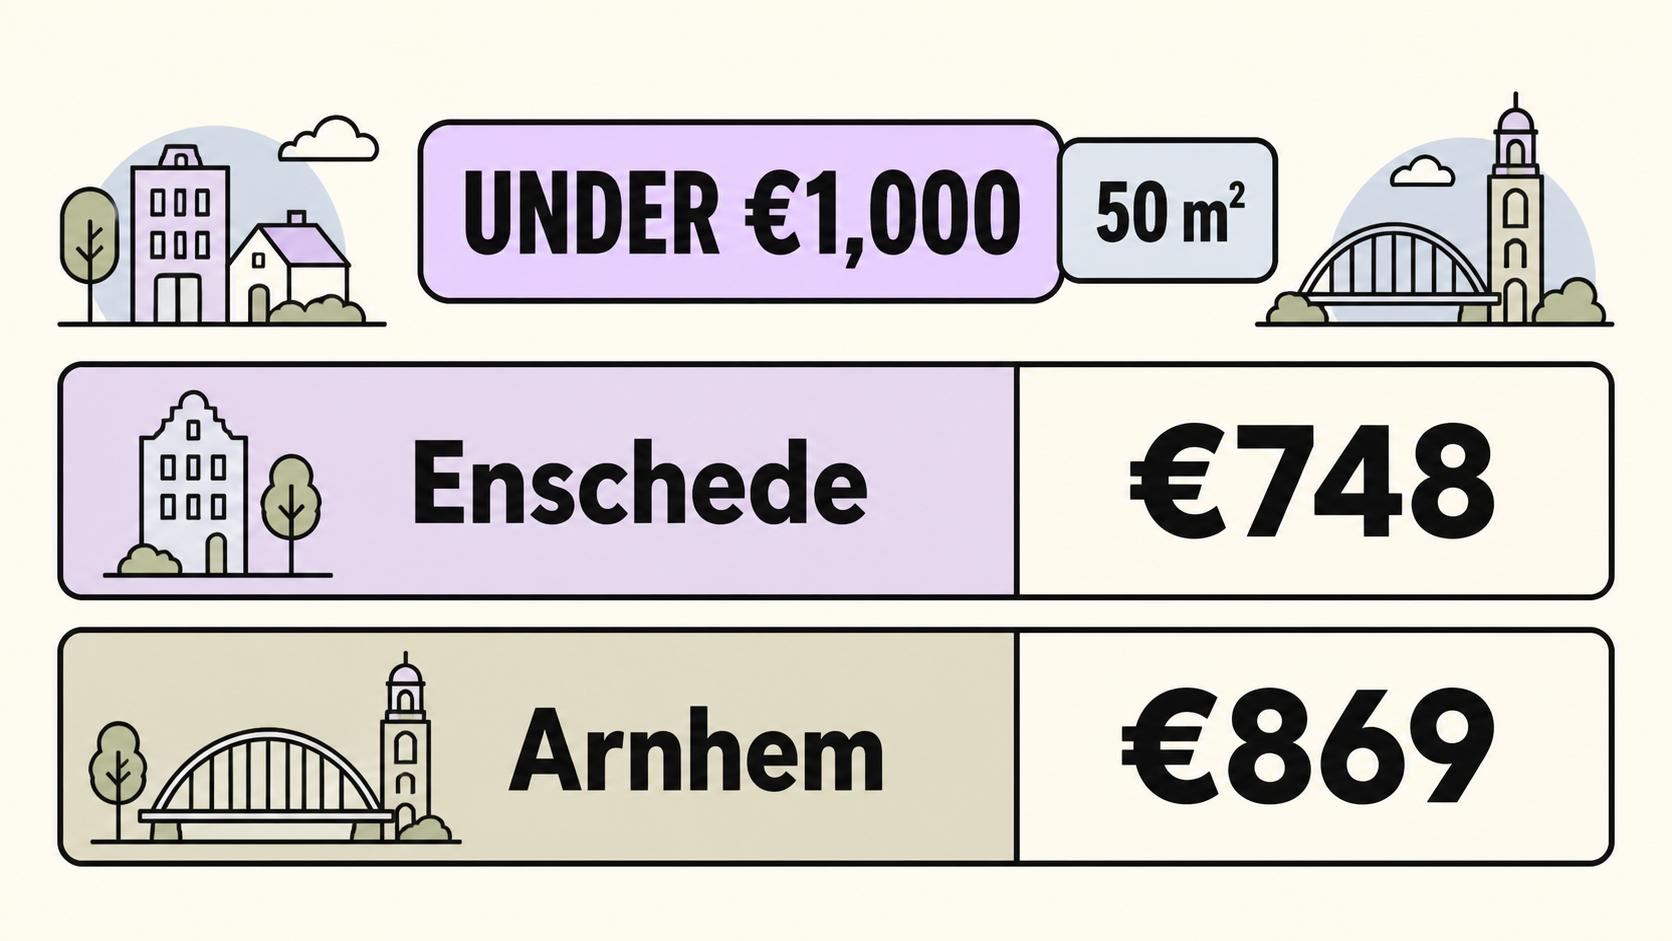
Enschede is the lowest example at €14.95 per m², or about €748 for 50 m². Arnhem is tenth at €17.37 per m², or about €869. Those figures help with a first screen. They do not include service charges, energy, insurance, furnishing, travel, taxes or the cash needed at move-in. A total rental cost is useful before treating the headline number as a workable budget.
Who this shortlist is for
- Renters who can choose between several Dutch regions.
- Households testing whether a smaller or regional city can lower basic rent.
- People comparing a low headline figure with travel, work, study and home-size needs.
- Applicants who want a repeatable city screen before searching live listings.
Treat this as a cost-led shortlist, then add work, study, transport and household-fit questions from the broader city shortlist for renting your own home. Price matters only when the city also supports your routine.
What “under €1,000” means here
The phrase describes an illustration, not a promised listing price. The screen is:
reported asking rent per m² × 50 m² < €1,000
That is the same as a city signal below €20.00 per m². Enschede gives €14.95 × 50 = €747.50, rounded to €748. Arnhem gives €17.37 × 50 = €868.50, rounded to €869.
The Q2 national signal was €20.94 per m², or about €1,047 for 50 m². Amsterdam was €28.69 per m², or about €1,435. The comparison shows the size of the starting gap. It does not say that a 50 m² Enschede home and a 50 m² Amsterdam home have the same condition, location, inventory or supply.
The rent data is a professional free-sector listing sample. The cheapest-rental-city shortlist reports the dataset and its limitations in more detail. Current availability, home quality and total cost still need an address-level check.
The legal-sector check people often miss
A basic-rent illustration near €1,000 can sit in a different legal context from a free-sector listing. For 2026, Rijksoverheid lists a social-rent ceiling of €932.93 and a liberalisation threshold of €1,228.07. The points calculation, initial rent and contract details determine the legal sector. A headline amount alone cannot do that job.
This matters for your next checks. The points system can affect rent review and which protection or information applies. The amount shown in an advertisement can also exclude service costs or utilities. Read the contract, record the basic rent and ask which charges recur each month. A rental contract review orders the terms by rent, charges, term, deposit and repairs.
Ten cities that pass the screen
The order follows the reported Q2 2026 asking-rent signal per m². The short notes add a use case and a question to verify. “Best” means best starting point for this narrow budget screen, not a universal city ranking.
1. Enschede
Q2 signal: €14.95 per m². 50 m² illustration: about €748 basic rent.
Enschede gives the lowest signal in this group. It can suit a renter whose work, study or household life is in Twente, or someone who can work online and values a lower starting cost. The saving loses value when regular travel to western cities becomes part of the routine.
Check next: the door-to-door trip, registration, energy performance, furnishing and the actual number of suitable listings.
2. Bergen op Zoom
Q2 signal: €15.18 per m². 50 m² illustration: about €759 basic rent.
Bergen op Zoom is a south-west option for someone with a flexible work area or a regional routine. A low signal can be useful when the renter can search the city and surrounding area together. Smaller supply can make the first suitable home harder to find.
Check next: current supply, the address-to-work journey, contract length and all recurring charges.
3. Zwolle
Q2 signal: €15.21 per m². 50 m² illustration: about €761 basic rent.
Zwolle combines a low Q2 signal with a more central regional position. The figure rose 12.19% year on year in the same dataset, which makes the research date part of the decision. Treat a live listing as stronger evidence than an older city average.
Check next: the home type, listing date, travel cost and registration position.
4. Leeuwarden
Q2 signal: €15.26 per m². 50 m² illustration: about €763 basic rent.
Leeuwarden is a northern budget candidate for a renter whose work and family routine fit Friesland. The basic-rent gap can be absorbed by travel when the destination is in the Randstad, so price the weekly pattern rather than one occasional trip.
Check next: frequency of travel, transport alternatives, energy costs and local availability.
5. Apeldoorn
Q2 signal: €15.55 per m². 50 m² illustration: about €778 basic rent.
Apeldoorn is a lower-signal choice for a regional household that wants a city setting without the largest-city headline costs. A renter may value the extra budget for space, setup or travel, yet that trade only works when the home and daily destinations align.
Check next: the complete journey, neighbourhood supply, contract duration and service charges.
6. Ede
Q2 signal: €16.23 per m². 50 m² illustration: about €812 basic rent.
Ede stays below the screen while its Q2 signal was 13.55% higher than a year earlier. That change is a useful warning about time-sensitive averages. Compare the listing’s date and condition with the city figure before building a long-term budget.
Check next: current asking rent, energy label, travel pattern and registration.
7. Helmond
Q2 signal: €16.81 per m². 50 m² illustration: about €841 basic rent.
Helmond can fit a south-eastern search where the renter’s work or study connects to the wider Brabant area. Its 20.97% year-on-year increase makes this one of the clearest examples of why a low rank is a snapshot rather than a forecast.
Check next: transport frequency, the true monthly charge, home quality and move-in costs.
8. Alkmaar
Q2 signal: €17.17 per m². 50 m² illustration: about €859 basic rent.
Alkmaar gives a lower signal for a renter whose fixed destinations sit in the north of the Randstad. The signal fell 3.39% year on year in the Q2 comparison. A single period does not establish a lasting fall, so use current listings for the final choice.
Check next: travel to the actual work address, local supply, furnishing and service charges.
9. Roermond
Q2 signal: €17.18 per m². 50 m² illustration: about €859 basic rent.
Roermond is a southern regional candidate with a signal almost equal to Alkmaar. It works best when the lower rent supports a fixed regional routine. A national list cannot assess the value of a particular neighbourhood or the time needed to reach work.
Check next: the work or study destination, local transport, registration and full monthly budget.
10. Arnhem
Q2 signal: €17.37 per m². 50 m² illustration: about €869 basic rent.
Arnhem closes the ten-city screen with a lower signal and a stronger urban comparison case than the smallest markets. A renter may accept €100 more basic rent than the Enschede illustration if the city reduces travel or fits work, study and services better.
Check next: door-to-door travel, neighbourhood, actual home size and charges outside basic rent.
Compare the budget by decision lens
- Lowest starting signal: Enschede, Bergen op Zoom and Zwolle. Use them when the region itself fits your routine.
- Lower signal with a central or regional balance: Apeldoorn, Ede and Arnhem. Price the travel that makes the location useful.
- Northern options: Leeuwarden and Alkmaar. Test the weekly destinations rather than a single commute.
- Southern options: Bergen op Zoom, Helmond and Roermond. Confirm local supply and the distance to the actual destination.
- More basic-rent headroom: Enschede leaves about €252 between the illustration and €1,000. Arnhem leaves about €131. That headroom can disappear through utilities, service charges or travel.
The difference between the lowest and highest qualifying illustration is about €121 per month. If a higher-signal city removes €150 of travel or makes a suitable home available sooner, the lower headline rent may be the weaker choice. This is why a rental options comparison should contain the home, not only the city name.
Build a real sub-€1,000 housing budget
Use the city signal as one line in a wider calculation:
- Record basic rent and the size of the home.
- Add fixed service charges and ask which items are advances for utilities.
- Estimate electricity, heating, water, internet and insurance.
- Add furniture, transport, parking, municipal charges and recurring subscriptions.
- Reserve the deposit, first month, moving costs and any initial purchases.
- Check whether the points and contract put the home in the rent sector you expect.
The setup trade-off depends on the furnished-versus-unfurnished choice. A lower basic rent can require a larger first-month outlay when the home is empty. A furnished home can carry a higher monthly amount while reducing immediate purchases.
A five-step city choice framework
- Set the size assumption. Replace 50 m² with the smallest home that works for your household, then recalculate.
- Choose two regions. Keep one lower-signal city and one city that shortens a fixed journey.
- Price the weekly routine. Count work, school, care, family and social travel over a normal month.
- Verify the legal and address details. Ask about registration, the points position, contract length and recurring charges.
- Compare live homes. A verified rental process and a rental options comparison keep address, contract and payment decisions together before you apply or send documents.
Frequently asked questions
Is €1,000 enough to rent a home in the Netherlands?
It depends on the home, city, legal sector and charges. In the illustration below, ten city signals produce a basic-rent amount below €1,000 for 50 m². Your total monthly cost can be higher after service charges, utilities, insurance, furnishing and travel.
Which Dutch city has the lowest rent signal in this list?
Enschede has the lowest Q2 2026 signal here at €14.95 per m². A 50 m² illustration is about €748 basic rent. The number describes a city sample and does not promise a live home at that amount.
Are these social rents or free-sector rents?
The comparison uses professional free-sector listing signals. The legal sector of a particular home depends on its points calculation, initial rent and contract details. A renter should ask for the basic rent and verify the applicable rules.
Does the calculation include service charges?
No. It is only reported asking rent per m² multiplied by 50 m². Add service charges, utilities, insurance, furnishing and travel in your own budget.
Why use 50 m²?
It makes city signals comparable with one repeatable assumption. It is not a claim about the right size for every household. Recalculate with the size you need before deciding.
Should I choose the lowest-ranked city?
Use the low signal as a starting filter. A city with a higher basic rent can work better when it shortens travel, improves home fit or reduces setup costs. Compare the whole month and the actual home.
Next step
Choose two cities from this screen, find one or two live listings in each and record basic rent, charges, travel and move-in cash. A rental options comparison records the address-level facts, while the rental process sets the verification order before you apply.
The city signals below are a dated comparison of professional listings and a 50 m² calculation. Add service charges, utilities, travel, furnishing and move-in cash before treating a city as affordable. If a listing is unclear, send us the city, size and headline costs through the contact form.
Ask about a city budget →